MatPlotLib (beta)
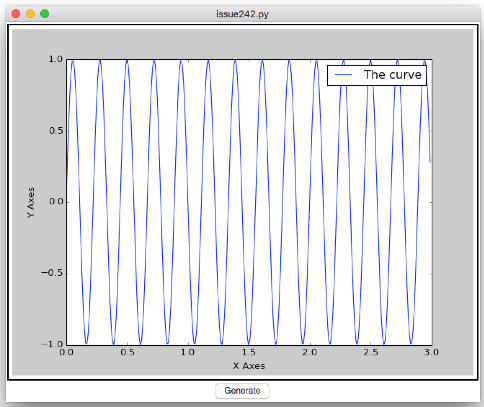
Support for embedding very basic MatPlotLib plots.
from numpy import sin, pi, arange
from appJar import gui
import random

def getXY():
    x = arange(0.0, 3.0, 0.01)
    y = sin(random.randint(1,10) * pi * x)
    return x,y

def generate(btn):
    # *getXY() will unpack the two return values
    # and pass them as separate parameters
    app.updatePlot("p1", *getXY())
    showLabels()

def showLabels():
    axes.legend(['The curve'])
    axes.set_xlabel("X Axes")
    axes.set_ylabel("Y Axes")
    app.refreshPlot("p1")

app = gui()
axes = app.addPlot("p1", *getXY())
showLabels()
app.addButton("Generate", generate)
app.go()
-
.addPlot(title, x, y)
Create a plot with the specified x and y values.
Returns the plot object, to allow further customisation. -
.addPlotFig(title)
Create an empty Figure, so that you can add your own plots.
Returns the figure object, to allow further customisation.
from appJar import gui
from mpl_toolkits.mplot3d import Axes3D

with gui() as app:
    fig = app.addPlotFig("p1")
    ax = fig.add_subplot(111, projection='3d')
    ax.scatter([1,2],[1,2],[1,2])
-
.updatePlot(title, x, y, keepLabels=False)
Update the specified plot with the specified x and y values.
NB. if you do this you will lose any customisations applied to the axes.
If you setkeepLabelsto True, then the axis labels & title will be retained.
Also, your app will crash, if you call this after.addPlotFig() -
.refreshPlot(title)
Call this any time you modify the axes.